


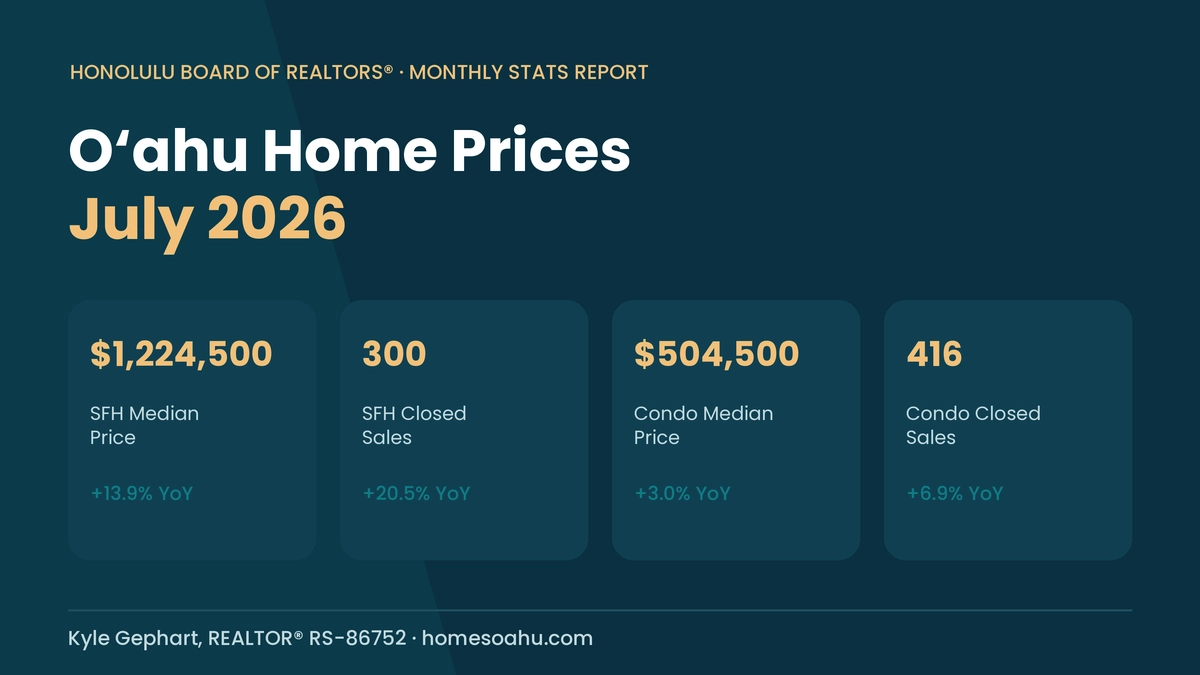
Oʻahu single-family home sales jumped year-over-year in July 2026 and the median price climbed with them, driven mostly by a surge in sales above $1.3 million. Condos moved up too, but slower. Homes are selling faster and closer to asking price than they were a year ago, on both sides. None of that means every home appreciated at the same rate, and the numbers below show why.
| $1,224,500 Single-family median price, +13.9% YoY | 300 Single-family closed sales, +20.5% YoY |
| $504,500 Condo median price, +3.0% YoY | 416 Condo closed sales, +6.9% YoY |
What Happened to Oʻahu Home Prices in July 2026?
Oʻahu’s single-family median sales price rose 13.9% year-over-year in July 2026, to $1,224,500, and the increase was driven almost entirely by a shift toward higher-priced sales rather than broad-based appreciation. Sales between $1,300,000 and $1,999,999 rose 76.9% year-over-year, from 52 to 92 transactions, and sales at $2,000,000 and above jumped 83.3%, from 24 to 44 transactions. A rising median in a month like this reflects what sold, not what every existing home gained in value.
The gap between Oʻahu’s median and average sales price makes the same point. The single-family average sales price in July was $1,458,986, up 16.1% year-over-year and roughly $234,000 above the median — a spread driven by a small number of high-dollar closings pulling the average upward. Condo pricing moved in the opposite direction on that metric: the condo median rose 3.0% to $504,500, while the condo average sales price actually fell 3.9% to $643,134, year-over-year.
Buyers priced out of the headline number still had options. Ninety-eight single-family homes, or 33% of July’s sales, closed under $1 million, and 202 condo sales, or 49% of the condo market, closed under $500,000. Through the first seven months of 2026, 34% of all single-family sales closed below $1 million and 47% of all condo sales closed below $500,000.
How Many Homes Sold on Oʻahu in July 2026?
Oʻahu single-family home sales climbed 20.5% year-over-year in July 2026, to 300 closed transactions, and condo sales rose 6.9% to 416 closed transactions. Both categories outpaced July 2025 despite a 30-year fixed mortgage rate that averaged 6.66% as of July 30, 2026, according to Freddie Mac’s Primary Mortgage Market Survey.
Year-to-date through July, single-family closed sales reached 1,686, up 6.5% over the same period in 2025, while condo closed sales reached 2,469, down 0.8% over the same stretch — a market where the detached-home segment is outpacing condos on both price and volume growth so far in 2026.
Seller activity picked up as well. Single-family new listings rose 3.0% year-over-year to 380, and condo new listings rose 9.3% to 707. Active inventory moved in opposite directions by product type: single-family active listings fell 5.9% to 802, while condo active inventory rose 3.9% to 2,554. Pending sales softened in both markets, down 2.1% for single-family homes and 16.3% for condos, though a few regions bucked the condo trend — including Pearl City (+60.0%), the Central region (+23.8%), and Hawaiʻi Kai (+16.7%).
Can You Still Buy an Oʻahu Home Under $500,000?
Yes. Buyers closed on 211 properties priced at $500,000 and below in July 2026 alone, bringing the year-to-date total to 1,214 sales, and 1,237 active listings in that price range remained available at month’s end. Most of that activity is concentrated in the condo market, where entry-level inventory is deeper than the single-family headline numbers suggest.
Aaron Tangonan, president of the Honolulu Board of REALTORS®, on the July median: “A monthly median is the midpoint of what sold—it isn’t a price tag on anyone’s home. The median rose 13.9% in July because sales above $1.3 million nearly doubled. In the same month, a third of single-family home sales closed under $1 million and 211 properties sold at or below $500,000. Behind those numbers are first-time buyers, families moving up, and longtime owners moving into something that fits them now.”
On affordability specifically: “More than 1,200 properties have sold at or below $500,000 on Oʻahu so far this year, and roughly 1,200 more are listed in that range right now. If homeownership is your goal, start by finding out what you qualify for and work with a trusted team of professionals to understand the resources available to you.”
Oʻahu Home Sales by Price Range, July 2026
Rolling up HBR’s published price-range data by tier shows where each market’s volume actually sits. Single-family sales are concentrated just above the $1 million mark; condo sales are concentrated well under it.
| Price Range | SFH Sales (Jul-26) | % of SFH Sales | Condo Sales (Jul-26) | % of Condo Sales |
|---|---|---|---|---|
| Under $1,000,000 | 98 | 33% | 374 | 90% |
| $1,000,000–$1,999,999 | 158 | 53% | 28 | 7% |
| $2,000,000 and above | 44 | 15% | 14 | 3% |
Compiled by Homes Oʻahu from the Honolulu Board of REALTORS® July 2026 Monthly Stats Report price-range distribution (300 single-family and 416 condo closed sales). Percentages rounded.
How Fast Are Oʻahu Homes Selling Right Now?
Oʻahu single-family homes sold in a median of 14 days in July 2026, down from 20 days a year earlier, and condos sold in a median of 38 days, down from 50 days. Sellers are also getting closer to their asking price: single-family sellers received a median of 100% of their original list price, up from 99.4% a year ago, with 33% of sales closing above asking — up from 26% in July 2025. Condo sellers received a median of 96.6% of asking, versus 96.3% a year ago, with 11% closing above asking, up from 8%.
That combination — faster sales, more offers at or above list — describes a market where well-priced, move-in-ready homes are getting competitive attention. It does not describe every listing or every region equally, which is why the regional breakdown below matters more than the islandwide number if you’re watching a specific area.
Which Oʻahu Regions Moved the Most in July 2026?
Single-family activity varied sharply by region in July 2026. Ewa Plain led on volume with 74 closed sales, up 45% year-over-year, at a $995,000 median. Several windward and central Oʻahu markets posted double-digit sales growth alongside meaningful price gains.
| Region | SFH Closed Sales | YoY Change | SFH Median Price | Price YoY |
|---|---|---|---|---|
| Ewa Plain | 74 | +45% | $995,000 | +10% |
| Kailua-Waimanalo | 28 | +33% | $1,782,500 | +2% |
| Pearl City-Aiea | 28 | +56% | $1,078,000 | +12% |
| Kaneohe | 24 | +20% | $1,150,000 | -3% |
| Mililani | 21 | +91% | $1,195,000 | +19% |
| Makiki-Moiliili | 14 | +56% | $1,840,000 | +29% |
| Waipahu | 13 | -32% | $1,130,000 | +26% |
| Hawaiʻi Kai | 12 | -8% | $1,637,500 | -1% |
Source: Honolulu Board of REALTORS® Local Market Update, July 2026, single-family homes only. Regions selected for sales volume; some small-sample regions posted larger swings not shown here — see the mistakes to avoid section below.
Condo activity told a similar story in Oʻahu’s two largest urban condo markets. Ala Moana-Kakaako closed 56 condo sales in July, up 40% year-over-year, at an $895,000 median, up 1%. Waikiki closed 82 condo sales, essentially flat year-over-year, at a $460,000 median, up 10%. If you’re comparing a specific building or complex against these area-level numbers, run a current comparative market analysis rather than applying an area median directly — our condo buying guide walks through what else to check before you offer.
Don’t Make These Mistakes Reading This Report
- ✕Treating the islandwide median as an appraisal of your specific home. $1,224,500 is the midpoint of what closed in July, not a value for any one property.
- ✕Reading a rising median as broad appreciation. Most of July’s increase came from a near-doubling of sales above $1.3 million, not from every price tier rising together.
- ✕Confusing average with median. Oʻahu’s single-family average sales price, $1,458,986, sits about $234,000 above the median because of a small number of high-dollar closings.
- ✕Assuming a fast islandwide days-on-market number applies everywhere. Regional median days on market in July ranged from single digits in some areas to 60 days in Downtown-Nuuanu.
- ✕Reading small-sample percentage swings as a trend. Downtown-Nuuanu’s single-family sales rose from 1 to 13 year-over-year, a 1,200% change driven by a tiny sample, not a market shift.
Frequently Asked Questions
How much did Oʻahu home prices rise in July 2026?
Oʻahu’s single-family median sales price rose 13.9% year-over-year in July 2026, to $1,224,500, according to the Honolulu Board of REALTORS®. The condo median rose 3.0% year-over-year, to $504,500.
Are Oʻahu condo prices going up or down?
Oʻahu condo median sales prices rose 3.0% year-over-year in July 2026, to $504,500, and closed sales rose 6.9% to 416. The condo average sales price fell 3.9% to $643,134 over the same period, reflecting fewer high-dollar condo closings relative to a year ago.
How long does it take to sell a home on Oʻahu right now?
Oʻahu single-family homes sold in a median of 14 days in July 2026, down from 20 days a year earlier. Condos sold in a median of 38 days, down from 50 days. Time on market varies by region and price point, so treat the islandwide figure as a starting point, not a guarantee.
Can I still buy a home on Oʻahu for under $500,000?
Yes. Buyers closed 211 Oʻahu properties at or below $500,000 in July 2026, bringing the 2026 year-to-date total to 1,214 sales, with 1,237 active listings in that range at month’s end. Most of this inventory is condos: 49% of July’s condo sales closed under $500,000.
What is the current mortgage rate for Oʻahu buyers?
The average 30-year fixed mortgage rate was 6.66% as of July 30, 2026, according to Freddie Mac’s Primary Mortgage Market Survey, up nearly a quarter point over the course of the month. Rates move weekly — verify the current figure directly at Freddie Mac’s PMMS page before relying on this number. Military buyers using a VA loan should confirm current entitlement and rate terms with their lender; see our VA and military home buying guide.
Is Oʻahu’s housing market favoring buyers or sellers right now?
By the numbers, sellers had the edge in July 2026: single-family sellers received a median 100% of their original list price, with 33% of sales closing above asking, and homes sold faster than a year ago. Single-family active inventory also fell 5.9% year-over-year to 802 listings, a tighter supply than July 2025. Condo conditions were more balanced, with active inventory up 3.9% and sellers receiving 96.6% of asking on average.
Verify These Numbers Yourself
- ✓Confirm the current month’s figures at HBR’s market press release archive.
- ✓Cross-check the price-range breakdown against the full Monthly Stats Report PDF for the month in question.
- ✓Check today’s mortgage rate at Freddie Mac’s PMMS rather than relying on this article once it ages.
- ✓Pull the Local Market Update for your specific TMK area before comparing a listing to an islandwide or regional median.
- ✓Get a current comparative market analysis from a licensed agent for your specific property instead of applying any published median directly.
Official Resources
- ✓Honolulu Board of REALTORS®, July 2026 market press release
- ✓HBR market reports archive
- ✓Freddie Mac Primary Mortgage Market Survey
- ✓HiCentral MLS, source of record for all figures in this report
Watching a specific Oʻahu neighborhood?
Islandwide numbers only tell part of the story. Text me the area or price range you’re tracking and I’ll pull the current Local Market Update for it, verified against the source data before you make a decision.
Text “START” to 808.400.3710 Contact KyleBefore you commit to any purchase based on market conditions alone, run through the statutory checks that apply regardless of how the numbers look — see the full Oʻahu home buyer due diligence checklist. Comparing Oʻahu against a mainland market you’re relocating from? Our relocation guide covers the logistics side of the move.
Written by Kyle Gephart, REALTOR® (HI RS-86752), Talk Realty / Homes Oʻahu Holdings LLC. More about Kyle.
All figures in this report are sourced from the Honolulu Board of REALTORS®, residential resales data compiled from HiCentral MLS, Ltd., for the month of July 2026, and from Freddie Mac’s Primary Mortgage Market Survey for the mortgage rate cited. Market data changes monthly; verify current figures before relying on any number here for a purchase or sale decision. This report is informational only and is not an appraisal, an investment recommendation, or legal or financial advice. Equal Housing Opportunity. Last reviewed August 2026.